|
(7/23/26): With the Strait of
Hormuz war expanding into the Red Sea, WTI crude oil surged more than $4 per
barrel to $91.45, while Brent crude climbed above $100 per barrel. Market
interest rates followed suit, with Treasury yields moving higher across the
curve and pushing to new 16mo highs.
(5/20/26): Close to three
months into the Iran war and subsequent closure of the Straits of Hormuz, crude
oil prices (WTI) remain high, trading around a $100 per barrel. The 2yr Treasury
rates, along with the rest of the curve, hit 15 month highs.
(3/13/26): Two weeks into
Operation Epic Fury the 2yr Treasury has spiked
higher by 40bps as California unleaded gasoline rose over 60 cents to $5.09 per
gallon. The high correlation between energy prices and interest rates suggest if
gasoline prices stay high, interest rates may have more room to rise.
(10/15/25): The 2yr Treasury
has return to the 3.50 level, the area last seen a year ago and most importantly
to Sept 2022 levels when Fed Funds were 2.50. This suggests the market is way
ahead of Fed policy anticipating multiple rate cuts ahead.
(3/21/25): As observed in the
previous post, showing 4.20 support, once the 2yr Treasury fell through this
level, it quickly began to consolidate back to levels that built the August and
October shoulder areas. It's now reasonable to see new support around
these shoulder lows, 3.86.
(1/30/25): Since forming a
reverse head-and-shoulders pattern August-October, the 2yr Treasury has made
several runs to 4.40 with support around the 4.20 area.
(10/31/24): Since the sharp
decline in market rates in late July and early August, followed by a month of
consolidation, and a rapid rise in early October with another period of
consolidation, the past several weeks has seen rates climb steadily higher. This
movement has formed a distinct reverse head-and-shoulders pattern. If this trend
follows previous patterns, the 2yr Treasury yield could reach 4.40 percent,
essentially completing the formation.
(8/07/24): Since its last peak
of just over 5 percent, the 2yr Treasury yield is once again approaching the
level where the Fed Funds rate was two years ago. This suggests that the 2yr
Treasury is �pricing in� over 200bps of Fed Funds cuts.
(5/23/24): After testing 4.75
support, the 2yr Treasury is making another run at 5 percent. We�ll have to see
if there will be multi-session closes above 5 percent to confirm another run
toward 5.20 percent.
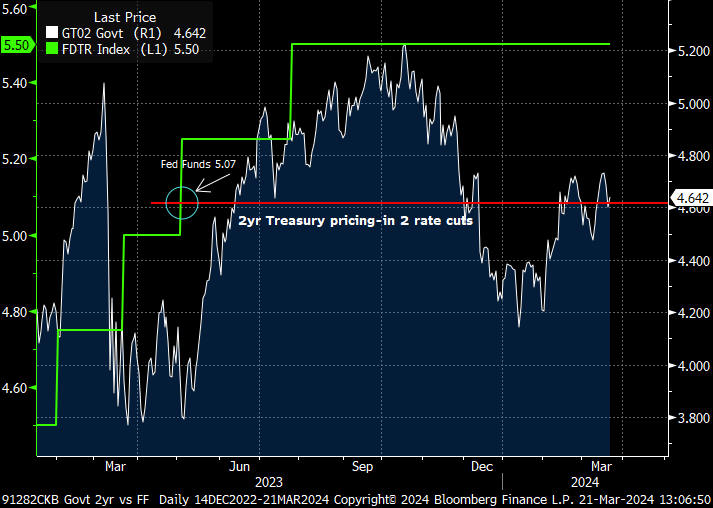
(3/21/24): The 2yr Treasury
rate has recovered from its mid-January low and is now pricing-in fewer Fed Fund
cuts in the months ahead.
(1/12/24): The 2yr Treasury
rate has been cascading down since the Oct. 18, 2023 high of 5.22, breaking
through several key support levels on the way south. It's now approaching a full
76 percent retracement from the top and back to when Fed Funds was 4.50-4.75.
(11/14/23): As observed over
the last few months, the 2yr has confirmed a rate top likely hit mid-October.
The other side of this massive move up in rates since the summer of 2020 now
looks over. The first line of support is the post the July rate hike on August
8th at 4.75. Then below is major support around 4.65-4.55. I would expect the
Fed would need to actually begin cutting Fed Funds to see the 2yr lower.
(9/06/23): Since March 2023, the 2yr Treasury
has hit just over 5 percent several times, only to fall back shortly thereafter.
With this recent pattern, either a top is forming at the 5 percent level or
perhaps it can push toward the June 2006 high of 5.28.
(3/02/22): The 2yr Treasury
peaked just shy of 17 percent in Sept. 1981 after 30 years of climbing
inflation, which accelerate in the 1970�s. Since that high in the early 1980�s
it�s been basically disinflationary conditions for 40 years bringing the 2yr
down to the COVID 0.10 percent low in Feb. 2021. If you believe in long-term
cycles as I do, the biggie questions are � have we started a new inflation
cycle? Could it last 30yrs or longer? If so, a Fibonacci retracement overlay
helps pick out some levels the 2yr may climb and find resistance/support along
the way. The first retracement is 4.10, which we blew through last Sept, but
than retested mid-January. Since then its been straight up. The next level is a
38 percent retracement at 6.55. That�s a long way from here, but if we�ve
entered a new long-term inflation cycle, entirely possible in the months/years
ahead.
(10/7/22): The 2yr Treasury
rate is up over 10x from a year ago (0.31 - 4.29) and is now back to August 2007
levels with no major resistance in sight until the five percent area.
(6/13/22): Higher than expected
inflation (May CPI 8.6 percent YoY) pushes the 2yr Treasury through the November
2018 high to levels not seen since late 2007. Fed funds futures are pricing-in a
funds rates target of 3.50-3.75 by the February 2023 FOMC. There is no
discernable technical levels of resistance below 4 percent.
(3/16/22): The Federal Reserve
finally began their highly anticipated series of Fed Funds rate hikes. But, the
market has been way ahead of policy members. The 2yr Treasury is closing in on
the equivalent of six 25bps rate hikes (based on the last tightening cycle
between 2015-2018), leaving the Federal Reserve way behind the curve (pun
intended).
(10/26/21): As COVID cases
decline and consumer spending rebounds, the 2yr Treasury
moves toward 0.50. Supply constrains have helped to push inflation higher
prodding the market to prepare for the Federal Reserve to begin tapering bond
purchases. Looking back at the last Fed Funds rate hike in December 2015, the
2yr Treasury ranged between 0.50-0.70 for over a year prior. Perhaps this same
pattern will unfold in the year plus ahead calling for a Fed tightening by late
2022.
(1/12/21): The 2yr Treasury
remains at historically low levels held suppressed by expectations the Federal
Reserve will maintain a zero rate policy through 2023.
(3/30/20): The 2yr Treasury
hit levels not seen since 2012, but still above the Sept 2011 low of 15bps. It's
hard to see current rates much lower from here as expectations the corona virus
will eventually subside and the slew of Federal Reserve liquidity measures and
fiscal stimulus kick in.
(3/04/20): Fear of the negative
economic impact caused by the spread of the corona virus have sent 2yr Treasury
rate to levels not seen since the height of the 2016 Brexit concern.
(6/26/19): Just like the 5yr
Treasury, the 2yr rate has been plunging since the November 2018 high. Applying
Fibonacci retracement levels, the 2yr has now pulled back half of its move from
the lows July 2016 to the November 2018 high.
(4/25/19): After plunging
through 2.35 support, down to 2.20 in late March, the 2yr Treasury has buoyed to
a very tight 2.30-2.40 range for most of April. Given the Fed's intent to pause
the Funds rate and put on-hold their balance sheet reduction plan by September,
its probably safe to assume the intermediate range is a bit broader, between
2.20-2.60.
(1/30/19): Similar to the 5yr
Treasury, the 2yr rate plunged in late December as equities tumbled, testing
2.35 on January 3rd. After briefly rising to 2.60, rates once again fell with
Fed comments shifting to "patience" about future rate hikes, removing its
previous reference to a gradual stance. Intermediate support is 2.35, but
there's a significant gap below that, 100bps lower.
(12/14/18): Like the 5yr Treasury, the 2yr has backed away
from an early November run at the 3.00 area and shows support around 2.60.
(7/24/18): The 2yr
Treasury rate pierced through it's last 2.60 resistance and now looks likely to
take a run at the 2008 high of 3.00.
(6/15/18): With the second Fed Funds increase in the hoop
for 2018 and according to Federal Reserve guidance, two
more to go this year, the 2yr
Treasury rate interim resistance moves up from 2.40 to 2.60. Support looks to be
around 2.20-2.25 should any significant pull-back occur.
(2/23/18): 2yr Treasury rate has been on a six month tear
breaking through 2.00 resistance. Inflation concerns, the Fed's shift from
quantitative easing to quantitative tightening (reducing the Fed's balance
sheet), further deficit financing (due to tax reform and increased gov't budget)
and the expectations of 3-4 rate hikes in 2018 have been major drivers. The next
major resistance is now 3.00, with intermediate resistance in the low 2.40's.
(12/20/17): The 2yr Treasury rate continues to surge to
multi-year highs. The next resistance level is around 2.00, which dates back to
late 2003.
(10/10/17): With a 77 percent probability (according to
the Bloomberg Fed funds futures implied rates function) of an additional rate
increase by the
December 13th FOMC meeting, the 2yr Treasury has broken to new 8yr highs.
(7/05/17): After the fourth Fed tightening since December
2015, the 2yr Treasury is back to levels not seen since the Fall of 2008.
(3/07/17): According to Bloomberg�s Fed funds futures
implied rates function, there is 90 percent probability of a rate hike on March
15th to 0.75-1.00 target range. The 2yr Treasury is now challenging substantial
resistance at a nine year high.
(11/16/16): Closely following expectations the Federal
Reserve will raise rates in December, the 2yr Treasury surges to 1.00.
(12/16/15): The FOMC voted today to raise the Fed Funds
target rate 25bps, ending its 7yr old zero interest rate policy (ZIRP).
(3/23/15): A volatile, yet persistent climb in 2yr
treasury rates since mid-2013 points to the 80bps area on any whiff the Fed will
move from its zero interest rate policy (ZIRP). When may that be? Per the Feds
most recent statement, not until inflation reaches 2 percent or higher, even as
recent employment data has improved beyond recent Fed expectations.
(7/15/14): It has been a year since I updated this chart.
There must be a reason. Maybe it's been too exciting to talk about 2yr treasury rates....not. Anyhow,
here's a somewhat encouraging chart if your looking for the Federal Reserve to
end it's zero interest rate policy within the next year or so. Intermediate
resistance has finally risen to around 50bps. So, if the market can sustain and
eventually make this level support, the next resistance area would be 80bps,
back to the rate where the first round of quantitative easing began.
(7/23/13): After a decisive break above 30bps in the
remaining weeks of June, the two year treasury retests its 24 month resistance
of 40bps. But just as fast as it rose, the rate has settled back to what we can now
call "soft" support at 30bps. The more likely range while the Federal Reserve
continuous its easy money policy and quantitative efforts should be 20-40bps.
(6/06/13): Still sandwiched between the low 20's and
30bps, the two year treasury is no doubt held hostage to the Fed's anchorage
policy at zero Fed Funds target rate. Perhaps we'll be seeing this ship moored
in the bay for years.
(4/02/13): Stuck in the middle. The two year treasury, as
with most all treasury maturities, has been bouncing along in an extraordinarily
tight range for almost a year.........hence there is so little to talk about
technical wise, these posts have been far and few between. I assume until the
market senses a Fed policy change, this boring trend will continue.
(6/07/12): It's been a bit too long since the last update.
I don't have any real good excuses for not not reporting more frequently on this
rate depression other than, well, its depressing to talk about! A little Prozac
later (just kidding), dusting off the Bloomberg 2yr chart function, reveals a
bit better trend - improving or rising lows from the historic Sept. 2011
bottom. While I wouldn't bet the farm we're about to take off and trade anywhere
above the now long-term 50bps resistance, the trend is encouraging we could see
some action in the mid-30's. Of course, if any new economic shocks hit sending
equities much lower (I still believe DOW 10k is possible within the
following
24 months), safe heaven treasuries could easily approach record lows again.
(08/08/11): Off the charts. That's where the 2yr treasury
has ventured, a new historic low post S&P's downgrade of US government debt. It
maybe counter intuitive to witness a price rally on a downgrade, but panic
selling in equities has driven many investors to the "safe haven" of US
treasuries, driving rates down. There is no technical support to work from at
this level, other than I assume the two year treasury rate stays above zero
(unlike the three month bill, which has gone negative yield multiple times
recently).
(06/01/11): While a double top was indeed confirmed around
the mid-80's level, the 2yr rate slipped right through the fingers of expected
55-60bps support. Next stop is the low 40's, which should hold, barring a major
equity market sell-off.
(04/19/11): The two year treasury near-term resistance
appears to have formed around the 85bps level, mirroring the same price action
as in the equity markets (not pictured). Double top? Possibly. But, I think the
real test is the mid-March lows caused by the Japan earthquake and middle east
unrest, around 55bps. Hard to believe a break below this level would lead to a
test of the 0ct/Nov lows, but that's what the technicals would suggest. My guess
is without a meaningful equity market correction, say about 20%, the more likely
support continues in the 55-60bps area.
(02/28/11): Not exactly what the Federal Reserve intended, rates are higher
since the announcement of the second installment of quantitative easing (QE2).
Two year treasury rates more than double to the low 80bps before retracing
toward intermediate support around 60bps.
(11/04/10): Rates fall to new historic lows on expectations the Federal
Reserve's recent announcement of the purchase of $600 billon in market
securities over the next six months. Clearly, Mr. Bernanke is doing whatever is
necessary to inflate asset prices in order to counter the incessant
de-leveraging from the private sector. The long-term costs of running the
government monetary printing presses in this hyper-drive state can be severe. The
dollar continues to set new lows. Commodities and gold prices surge. Bond prices
reach bubble levels. What happens when all this government intervention comes to
an end and the massive accumulated tax-payer debt needs to refinanced or paid
down? Will there be enough willing buyers for US Treasury and government securities
at present rates? Or will the market (includes many over-seas buyers) demand
higher rates to be compensated for potential inflation and /or perceived credit
risk?
(8/17/10): As expected in the last observation three months ago, we came
within points of reaching 10,700 Dow on August 9th. But did surging equity
prices send rates higher? Surprisingly, no. It appears there's a winner-take-all
death battle going on between the equity market's optimism for economic recover
and the bond market's fear of a slow down or worse, double dip recession. Which
scenario wins? We'll find out soon enough. Personally, I'd trust the bond
markets prediction as seen. It's always been the best economic indicator,
particularly the shape of the yield curve. As it's flatted over the last few
weeks, it too is a sign for tougher times ahead.
(5/24/10): Deflation, de-leveraging (excluding sovereign debt) and fear of a
global double dip recession/depression send safe heaven treasuries rates to lows
seen only a couple times since the financial crisis began. While major support
exists at the 70bps level for 2yr treasuries, all bets are off if world
equity markets continue to tumble. This author's forecast is the Dow will trade
into the 8k's later this year, bringing rates down further. But, I doubt that
happens now. I'd expect at least another run to test 11,300 Dow (at least
10,700) before a dive later autumn or late summer.
(3/18/10): Looking like a EKG graph of an irregular heartbeat, the 2yr has
pretty much steadied around 90-100bps for the last 12 months with momentary
spikes up and down, but mostly up. A precursor to higher rates ahead? One thing
is certain, if the Feds' "free money" defibrillator jolt finally takes hold, the
2yr rate resting pulse will be closer to the highs of the last 12 months
(1.20-1.40).
(12/31/09): Finally, the breakout to higher rates we have been expecting was
confirmed in the waning days of 2009. The two treasury aggressively pierced a
long 12 month resistance of 1.00, and also confirmed a double bottom set on
12/08 and 12/09 at 65bps. If we take technical analysis a step further, we
could make a case that an inverted head and shoulders has also formed over the
same period, resulting in total reversal of the pervious pattern. Meaning,
higher rates ahead!
(10/07/09): While we reached 1.40 within days of the last observation, the
two year could not hold these levels and preceded to plunge back through support
to sub-one percent. At this point, until the hoarding of short-term
treasuries becomes less attractive than the potential loss of holding these
positions when the Fed moves away from a "free money" policy, 1.00 looks to be
strong resistance.
(6/05/09): A better than expected jobs report sends the two year treasury
rate screaming through 1.00 resistance. Next stop, 1.50.
(3/18/09): So far, the two year treasury rate bottom of mid-Dec is holding
and a slight upward channel has developed. This suggests the worst of negligible
rates is behind us.
(2/03/09): Is it possible treasury rates have bottomed? Certainly a question
I have been searching for these last few months may now look answered. The
12/16/08 low of 0.65 followed by weeks of base building suggests higher rates
ahead.
(12/01/08): Treasury rates have plummeted to historic lows with buyers
clearly concerned more with the return of principal than any reasonable yield on
principal. The good news, with just 88 basis points north of zero, it is easy to
assume any bit of encouraging economic news or first signs of inflation (lots of
dollars being printed), will quickly put a digit back on the left of the decimal
point.
(10/08/08): Financial market Armageddon continues with the flight to
treasuries sending two years rates back to March lows. Bounce from here?
Technically yes, but with zero confidence in world credit markets....who
knows.
(9/15/08): Major credit woes in the financial sector continue to dominate
treasury rates. From last week's federal takeover of Fannie Mae and Freddie Mac,
to this weekend's announcement Bank of America will gobble up Merrill Lynch, to
this morning's Lehman bankruptcy and AIG's questionable solvency - its no
mystery treasuries are in high demand sending rates through recent support
levels.
(8/12/08): Multiple attempts have been made to break down below the 2.40
level, confirming support has developed in this area. While it is possible
that further weakness in the US economy could move rates lower, any good news on
top of this technical pattern is more likely to send the 2yr treasury
rate back on it's way to 3.00+.
(6/13/08): We met our 3.00 target yesterday as the market has moved to fully
pricing in a 50+bps hike in Fed Funds. To much, too soon? Probably. I'd expect a
pull back to 2.50-2.75 before another test to 3.00+.
(6/04/08): After hitting a recent intraday high of 2.75 on 5/29 , the two
year treasury pulls back to test support. While it's possible we could see 2.00
again in this cycle, the more probable support area is around 2.25.
(4/30/08): As stated in the previous observation, an upside breakout occurred
over the last several weeks, sending the 2yr treasury rate on it's way to 3.00.
(4/08/08): Looks like a bottom has formed in the 1.50 area (75 basis pints
below current Fed. Funds target). While 2.00 offers some resistance as rates
point higher, I believe 3.00 will be here sooner than most folks think.
(3/03/08): "Das Boot"? Like the 1982 Academy Award nominee submarine
movie..........rates dive, dive, dive.
(1/03/08): First, please let me admit I've been persistently and consistently
wrong about the direction of treasury rates in this recent downward trending
cycle this last few months. Now with that confession over, I still believe
fundamentals will win the day as necessary family spending continues to drive
the economy foreword (despite the subprime mess). Add in the likelihood bond
performance won't continue into 2008 at another +9.9% clip (Bloomberg 3-5 year
Govt. index total return) as it did in 2007 and we should have better rates
ahead.
(10/24/07): After a brief increase in rates into mid-October, yields across
the curve plunge to new 12 month lows. Where to from here? Unless you believe we
are entering into a recession (I certainly don't) and think rates will continue
to drop, I wouldn't be a big buyer here.
(8/31/07): Sub-prime loans, hedge fund redemptions, and stock market
correction woes have plunged treasuries rates way below what I thought could be
possible this cycle. A minor triangle pattern has developed from 4.02 low on
August 20th. So if the overall economic fundamentals remain positive, we should
see rates move higher.
(7/27/07): Following an amazing decline in rates from the recent 5.09 top on
June 12th, the two year treasury yield is getting very close to a substantial
bottom. This is an easy suggestion to make - don't buy bullets at these levels,
callables are okay, since the probability of a rebound in rates is very high.
(6/15/07): In an incredible (virtually non-stop) 6 week move up in rates, the
2yr treasury blows through 4.98 resistance. This sets the new range between 4.98
support and 5.28 (6/28/06 high).
(5/16/07): As stated in the previous observation, a upside breakout
occurred in early April, sending the 2yr treasury rate immediately to 4.74
resistance. Following a test back to the 4.60 lunch point, we've now advanced in
a pattern of higher highs and high lows, again, to 4.74 resistance. This is also
a 50% retracement level of the 4.98 high (1/29/07) to the support low of 4.50
(12/5/06 and 3/13/07).
(4/4/07): A "symmetrical triangle" (characterized as areas of indecision) has
formed over the last four weeks. Research has shown that these patterns
overwhelmingly resolve themselves in big moves typical in size equal to the
widest part of the triangle. With major support holding at 4.50, we may possibly
see 4.70+ sooner than later.
(3/2/07): An overdue correction in the equity markets finally materializes,
sending the two year treasury rate plummeting to towards the 4.50 major support low,
as investors flee to the safety of government debt instruments. Unless you
believe the U.S. is headed for a recession in the next few months, this is not
the time to be an aggressive buyer of treasury debt.
(1/23/07): Since the recent December 5th low of 4.50, rates have rebound
through 4.80 resistance. This sets up a new range of 4.80 to 5.00.
(12/29/06): A sharp decline to the 4.50 level occurred in just a few days
after the 11/27/06 observation. But just as quickly, rates rebound to 4.70,
taking with it the possibility of testing January 2006 lows. Currently, the
short-term resistance area is around 4.80.
(11/27/06): Narrowing volatility or the range of movement in the 2yr treasury
rate over the last several weeks suggest a large breakout is near. Which way?
Could be down. A break below 4.63 would confirm and suggest further weakness to
4.25, January 2006 lows.
(10/27/06): Support continues to holds at 4.63.
(9/29/06): The two year treasury rate tests a possible double bottom and new
support at 4.63, piercing previous support.
(9/7/06): Fifty basis points below current 5.25 Fed Funds target rate, the
2yr treasury may have put in a temporary low at 4.74 on Sept 1. Overhead resistance
remains in the
5.10-5.20 area.
(8/7/06): With lower highs and lower rate lows over the last two weeks, the
predictable upward channel chart created over the prior12 months, may have ended. The
best guess now is support pulls back to 4.90, and resistance moves to the
5.10-5.20 area.
(7/20/06): As inflation worries ebb, the 2yr rate pulls back to 5.10, right
on the support line of this upward channel.
(6/20/06): It's been a week since we broke long-term
4.90-5.00 resistance levels. Where to from here? With inflation worries in
excess of reality, I find it hard to believe the 2yr can sustain levels above
the next target resistance of 5.50.
(5/30/06): Major multi-year resistance holds at the
4.90-5.00 area.
(4/28/06): Major multi-year resistance continues to hold at the
4.90-5.00 area.
(4/4/06): The 2 year treasury rate continues it's march to major resistance
at
4.90-5.00.
(3/2/06): We are closing in on a major multi-year resistance level in the
4.90-5.00 area. What can break us through to higher rates? Higher than expected
inflation.......don't bet on it.
(2/6/06): The large and quick move predicted in the previous posts has
occurred. The two-year treasury should now move in a consolidated pattern
with resistance in the 4.90-5.00 area. Support moves up to 4.40-4.50.
(1/13/06): The triangle pattern observed several weeks ago has now developed
into a "bull flag" pattern. Flag patterns represent brief pauses in a
dynamic market. They are typically seen right after a big, quick move.
The market then usually takes off again in the same direction. Research
has shown that these patterns are some of the most reliable continuation
patterns.
(12/20/05): A triangle pattern continues to form in text book fashion. The
next big move is usually a breakout in the direction of the long-term trend. In
this case, up.
(12/2/05): After testing the 4.30 level twice and the possible double top at
4.48, the 2yr year yield now looks like we have entered into a narrow trading
range between 4.50 and 4.30.
(11/17/05): Possible double top at 4.48. We could come down to 4.30,
even 4.20.
(11/03/05): Rates continue to move higher following the 12th strait Fed
tightening The target resistance level remains 4.66.
(10/13/05): Rates continue to move higher with the 2yr moving toward 4.66
resistance.
(9/20/05): Despite the effects of Hurricane Katrina, the Federal
Reserve voted to raise the Fed Funds target rate for the 11th straight
time. The 2yr moves back to the 50% retracement level of the huge move from 6.90
(May 18, 2000) to 1.07 (June 13, 2003).
(9/1/05): The great unwinding of the markets expectation of further Federal
Reserve tightenings is upon us. The 2yr has dropped 37bps since Hurricane
Katrina hit our shores. Possible support is around 3.68.
(8/25/05): 4.00 appears to be the new support level. This is reinforced by
the 50% retracement level from the May 2000 highs (see 7/29/05 comment).
(8/10/05): After 10 Fed Funds increases in just over 13 months, the 2yr
breaks through 4.00. Next big test is 4.65. Maybe this would "price
in" the ultimate Fed Funds target of 4.00-4.25.
(7/29/05): The 2yr treasury rate moves past months of near term resistance
and now faces the 4.00 level which is the 50% retracement level of the huge move from 6.90
(May 18, 2000) down to 1.07 (June 13, 2003).
(7/18/05): Testing 3.87 resistance.
(7/06/05): We are now entering our 3rd month of a 40bps channel
(3.48-3.87).
(6/20/05): Since the 3.87 March 28th high, we have been in a very choppy
market mainly between 3.75 to 3.48.
(6/8/05): With a sharp break through major support of 3.58 to 3.48, we're
back to a very narrow trading range of 3.58-3.64.
(5/26/05): No break in major support on a recent pull back to 3.58. With the
fed funds target expected to rise to 3.25 on June 30, the 2yr rate should trade closer to 3.75.
(5/17/05): Higher lows continue to support this text book example of an
upward channel chart.
(5/04/05): The recent rise in the fed funds target to 3.00 should provide
major support at 3.48. Near term resistance is 3.87 with an ultimate test
to 4.00 sometime this year.
(4/21/05): After breaking minor near term support, and a brief dance at 3.48,
we are roughly 50bps above the May 3rd expected fed funds rate target of 3.00.
Historically there is a 50bps spread to the 2yr above fed funds when the federal
reserve is "neutral" in it's bias. Unless we believe this
"neutral" level has been reached and announced as such on May 3rd, we
should expect the 3.48 level to become our major near term support.
(4/13/05): Finally the long awaited pull back has begun. The 2yr has
dropped from a 3.87 high on 3/28 to 3.67 today. Minor near term support is 3.60.
(3/23/05): This is very interesting. We're now trading around both the spike
low in rates in 1998 and also the spike high in 2002.
(3/10/05): The 2yr rates have been in a non-stop rise in the last 4 months.
As you can see in this Fibonacci overlay chart, 4.00 is major resistance at the
50% retracement level of the huge move from 6.90 down to 1.07. The near
intermediate range is now 3.29-4.00.
(2/23/05): With inflation coming in a little bit higher on the wholesale
level (PPI +4.4 vs 3.9 expected), but partial offset by lower than expected CPI
(3.0 vs 3.2), rates stabilize around 3.40. The above chart shows we
challenged and went through 3.25, a Fibonacci retracement number from the May
2000 high of 6.90. You can also see 4.00 would retract 50% of this
large move, which will be substantial resistance.
(2/11/05): As expected, consolidation has begun around the 3.25 level. In
order to break out of this, to higher rates, we will need to see inflation at
levels higher than already expected.
(1/28/05): We have tentatively crested the 3.25 resistance level. Certainly
the over all trend line calls for higher and higher rates, as seen in this
pattern. But, with fed funds at 2.25 and fully expected to rise to 2.75 by the
March 22nd meeting, the 2yr has already priced in a considerable amount of the
expected tightening.
(1/10/05): We're now hitting 3.22, just a few basis points from resistance.
(12/28/04): Again, without a stock market correction, 3.25 will be here
sooner than later.
(12/17/04): Bearing a stock market correction, rates are up, up and away (at
least to 3.25 near term resistance).
(12/7/04): There is no technical observation that would conclude anything
other than rates are headed higher. Intermediate range remains 2.80-3.25.
(11/24/04): Up, up and away to levels not seen since June 2002. The new range
is now 2.80-3.25.
(11/18/04): It may be too early to move the observed support up to 2.80, but
it's clear we'll eventually be there. Resistance remains at the June high
2.93.
(11/08/04): A surprisingly good employment report sends rates rocketing to
2.80 resistance. New support moves up to 2.60.
(10/25/04): The 4% stock market correction, accurately predicted by the VIX
index, so far, has not been enough to change the over all direction in rates....up.
Major support remains at 2.37.
(10/15/04): The break-out to higher rates stays intact. If there is anything
that could bring us back to 2.37 support, it would be a greater than expected
stock market correction. On Oct 1, the VIX index hit a another low, which we've
seen many times, has accurately forecasted a minimum 3-5% decline in
stocks.
(10/08/04): As observed in the last post, the monthly non-farm payroll
estimate was at risk. Expecting 150k new jobs in September, rates drop on an
increase of only 96k (August also revised down). It's too early to tell if this
is a complete reversal of the recent upward trend in the 2yr. The market remains
fully priced for a Fed tightening in Nov to 2.00 Fed Funds.
(10/05/04): Are the fundamentals running against the technicals? Rates
will not be going up, if this Fridays job report brings less than the expected
150k increase. According to the employment survey conducted by Challenger,
Gray and Christmas, job cut announcements reached a 8 month high
in September. This report is highly correlated with the Labor Bureau's
monthly report (non-farm payroll).
(9/29/04): Is this the start of the big rate break out? If it is,
looks like we're headed higher. A close above 2.60 should confirm this. We just
need to be aware of a possible stock market correction that would force a flight
to quality rally in the treasuries (rates down). The S&P 500 volatility
index (VIX) continues to predict a sell-off.
(9/21/04): The Fed funds target rate, as expected, is raised 25bps to
1.75. The 2yr continues to traded in a narrowing range. As mentioned in
the previous post, this is the set-up for up for a very explosive move.
(9/10/04): Lower rate highs since mid-May show firm downward trending
resistance currently in the 2.60-2.55 area. With 2.37 forming the short
term support, the finally battle to break out of this narrowing range is near.
Which way? If you follow the progressive downward channel seen in the 5yr chart,
you would assume, down. Hard to believe. Isn't it?
(9/3/04): A more encouraging employment report helps break the 2.50
intermediate resistance. Next test is at 2.65.
(8/20/04): Lower rate lows and lower rate highs since mid-June, plus the
recent failed attempts to break through 2.50 resistance, runs contrary to most
opinions. This is where technical analysis can shine a very bright
light.
(8/12/04): The 2.50 area becomes intermediate resistance.
(8/6/04): July's much lower that expected jobs data, plummet rates through intermediate
support. 2.00-2.09 comes back in focus as the next support level.
(7/28/04): Intermediate support continues at 2.50.
(7/21/04): Intermediate support is confirmed at 2.50.
(7/6/04): The fed funds/2yr yield spread narrows to 130bps. Support at
2.50.
(6/18/04): At 200bps over fed funds, the 3.00 level remains solid
resistance.........that is, until the FOMC meeting on June 30.
(6/9/04): With the 2yr sitting at 2.75, we've knocked and broken through
near-term resistance. The next challenge is around the 3.00 level.
(6/7/04): It's back. We're knocking on the 2.70 resistance door. Could be
another short-term buy point.
(5/27/04): A short-term buying opportunity at the 2.70 resistance has come
and gone. While it's possible we could pull back to the low 2's, there is a very
high probability we test 2.20 intermediate support (38% retracement of the
+120bps move from 3/24-5/13).
(5/18/04): As indicated below, temporary resistance proves to be 2.70.
(5/7/04): Our monthly market mover strikes again. The first Friday of each
month brings the new jobs growth data. Today's report again surprises the market
with much better than expected growth. The 2yr has clearly priced in a 50 basis
point hike in Fed Funds by August. Support now moves up to 2.09, and slight
resistance at 2.70.
(4/29/04): So much for reason. We're now 135bps above Fed Funds and through
the 2.29 spike low set on Nov. 7, 2001. Where to from here? Support at 2.00 with
new resistance yet to be created. Bear in mind, back in the last aggressive Fed
tightening cycle of 1994, the spread between Fed Funds and the 2yr hit over
200bps.
(4/28/04): After a 60bps+ move up in just 4weeks, and a spread of 120bps+
over Fed Funds, it's reasonable to assume the 2.23 high on April 23 will stand for
awhile.
(4/21/04): The last ingredient needed for sustained higher rates has been
added. Chairman Greenspan warns that Fed Funds will rise (someday) to keep pace
with inflation. 2.09 should now become support.
(4/19/04): The 2.09 level holds and confirms strong resistance. Until there
is a imminent Fed. tightening priced into the market, it will be very difficult
for the 2yr to expand over the +109 basis points high to current Funds target.
(4/12/04): If we hold 1.80 on any near future pull-back, I would expect 2.00+
be hit soon after.
(4/5/04): Massive break-out. Not only did we remove 1.60 as resistance, but
all in one day blew through the next challenge of 1.80. It's now very clear to
see the new 1.80-2.09 range.
(3/29/04): 1.60 intermediate resistance is being challenged. If you wanted an
excuse to do some buying, here it is.
(3/24/04): Not too much to add to the two previous observations, except that
buying would be best at closer to 1.60, while holding off purchases towards the
1.40 area.
(3/17/04): No test yet of the 1.40-1.60 support/resistance levels. Be
prepared. The longer we stay in this narrow range, the bigger the break-out move
can be.
(3/10/04): Firm resistance at 1.60. Expected a test of 1.40-43 intermediate
support.
(3/5/04): Another below forecast employment report sends the 2yr through
1.60. As anticipated by previous observations, a big move was coming. Is this
it? Can the 2yr really head towards 1.20. Yep.
(3/4/04): Still within range. But, it's very clear a break out is near. Do we
take out 1.60 and head to the 1.20's or go through 1.75 back up to 2.00+?
We'll know soon.
(2/26/04): No break-outs....yet.
(2/20/04): 1.60 continues to hold offering good support. But, a possible
"descending
triangle" has developed. Does this mean rates are headed lower?
Check out the link in the previous sentence.
(2/12/04): 1.60 continues to hold offering good support with 1.82 the confirmed resistance.
(2/04/04): So far, 1.60 support is holding with 1.80 as minor resistance.
(1/29/04): Greenspan drops "considerable period" phrase signaling
to the market they may raise rates sooner than later.
(1/27/04): We continue to build support above 1.60.
(1/20/04): Consolidating around the 1.64 level. The longer we stay here and
build a base similar to mid-Sept and early Oct, the more likely we can set up a
move back to 2.00+.
(1/13/04): The mess just got worse. No bounce at 1.60. Can you believe it?
The next major support is the Oct. 1, 2003 low of 1.44.
(1/9/04): This chart is a mess. About the only thing to conclude is, the range remains
1.60-2.09.
(1/7/04): Back to quite again. 1.80 looks like support.
(1/5/04): Can we drive to new highs? 2.09 is the rate to beat.
(12/29/03): The last 3 weeks have been very quite with a range of 1.78-1.85.
It's anyone guess from here. We're right smack in the middle of the greater
1.60-2.03 range.
(12/17/03): Since breaking the ascending triangle pattern, we've been setting lower highs and lower lows. This is
now indicating
market (rate) weakness. Support 1.60?
(12/12/03): Has the proverbial rug been pulled out from under the months of
building a pattern of much higher rates? Or is this just a continuation of a long term drop in rates.
(12/10/03): The ascending triangle pattern continues to form in text book fashion.
It's getting harder to deny that the next big move will be higher rates.
(12/5/03): Disappointing job data causes the floor to drop out at the 2.03
primary support level. The next test, if we are to continue in this
ascending triangle pattern, is 1.80+.
(12/1/03): Here we go. A solid break above the 2.03 resistance (which now
becomes support) results in a new12 month yield high. As stated over the last
several updates, look for 2.40-2.60.
(11/26/03): The ascending triangle pattern continues to develop. A break
above 2.02-2.03, rates we could easily see 2.40-2.60 by Q1 2004.
(11/19/03): The previously observed symmetrical triangle pattern has now
morphed into an ascending triangle. This is a variation offering the same
results. With a break out above 2.02-2.03, rates could easily track to 2.40-2.60
within months.
(11/14/03): We should hold here at 1.80 if we are to maintain the current
pattern. 2.02-2.03 is now resistance.
(11/7/03): As stated in the previous observation, a break out of a "symmetrical triangle"
pattern usually concludes with a large move in the direction of the previous
medium and/or long term trend. Believe it or not, if the
this rule holds, we could see the 2yr trade to 2.40-2.60 in the next several
months.
(11/4/03): Forming a "symmetrical triangle" (characterized as areas
of indecision). Research has shown that symmetrical triangles overwhelmingly
resolve themselves in the direction of the trend. If you believe the downward
trend is still in place, then
you would assume the break out will be lower rates. The opposite would be true
if you measured a new trend from June 2003.
(10/28/03): Flip a coin. Could go either way. The range remains 1.60-2.00.
(10/20/03): If we bounce at 1.80, expected a retest of 2.00+.
(10/14/03): No doubt, the 1.60 level has become an important level.
(10/3/03): Very interesting. We are back to late April's (1.60) symmetrical
triangle completion point.
(9/30/03): On our way to 1.44-1.40.
(9/15/03): Back to the apex of the "symmetrical triangle" (1.60
completed 4/29). If we don't hold here, next level is 1.44 (62% correction in move from
6/24-9/2).
(9/8/03): Initial support at 1.67 (38% correction in move from 6/24-9/2).
(8/22/03): Breaking out to new highs?
(8/15/03): Consolidating around resistance. Forming a top or base building
for higher rates?
(8/11/03): Testing 1.78 resistance.
(8/8/03): Market hits 1.65. Do we stay in this upward channel? My guess is we
have seen the high rates for the summer.
(8/5/03): If 1.78 holds as major resistance, we could easily trade back to
1.62.
(7/24/03): Upward channel becomes very clear.
(7/21/03): Break above 1.50 resistance. Confirmation of higher and higher
rates?
Possible downward channel begins with June 26th high. Notice lower highs and
lower lowers with 1.33 becoming a critical reflection point.
Since the beginning of May, a very clear downward channel has been forming.
While this pattern does not offer a clear target (no bottom in sight), it does
suggest a rise in rates should we trade above the top line (resistance).
A perfect "symmetrical triangle" formed between March 10th-April
24th. If general technical rules were applied, we would ultimately test 1.00-1.10 yields
on the 2yr treasury. On June 12th we closed at 1.10.
"Symmetrical triangles can be characterized as areas of indecision.
A market pauses and future direction is questioned. Typically, the
forces of supply and demand at that moment are considered nearly equal.
Attempts to push higher are quickly met by selling, while dips are seen as
bargains. Each new lower top and higher bottom becomes more shallow than the
last, taking on the shape of a sideways triangle. (It's interesting to
note that there is a tendency for volume to diminish during this period.) Eventually,
this indecision is met with resolve and usually explodes out of this formation
(often on heavy volume.) Research has shown that symmetrical triangles
overwhelmingly resolve themselves in the direction of the trend. With this
in mind, symmetrical triangles in my opinion, are great patterns to use and
should be traded as continuation patterns. (Chart
examples of symmetrical triangle patterns using commodity charts.) (Stock
charts.)"
The following technical observation is provided by http://www.chartpatterns.com
|