|
|
 |
|
|
|
| |
The
Robinson Report |
A quick
and simple weekly
market performance report.
|
Monday, January 29, 2007
|
|
![]() |
| |
Week
in review:
-
The
Markets
� Despite the Dow
setting its fourth record high of 2007, the major index ended a
volatile week with a loss. As economic indicators maintain mostly
positive results, the chances of the Federal Reserve initiating a rate
cut fade. According to the Fed Funds futures market, there is less
than 5 percent (virtually nil) probability of a cut by the June FOMC
meeting. The Dow closed out the week down 0.62 percent to 12,487.02.
The S&P dropped 0.58 percent to 1,422.18, and the NASDAQ lost 0.65
percent to close at 2,435.49. Only the small company indexes showed
slight gains.
-
Home Sweet Home
� The National Association of Realtors reported that sales of
existing homes were down 0.8 percent last month, a bigger decline
than had been expected. For the year, sales fell by 8.4 percent,
the biggest annual decline since 1982, when existing home sales
fell by 17.7 percent in the midst of a severe recession. Even with the sharp drop in sales last year, the median price
of an existing home sold in 2006 managed to rise a slight 1.1
percent. But that was far below the double-digit gains during the
boom years. The median home price had risen by 12.4 percent in
2005.
-
Consumers More Positive Than Analysts
� Consumer sentiment climbed from an index reading of 91.7 in December
to 98.0 in January, according to the Reuters/University of Michigan
Surveys of Consumers. That exceeded economists� forecast of 92.5 and
is the highest reading since January 2004 when the index hit 103.80
-
Up More Than Inflation
�
Over the last 20 years (1987-2006), the
average cost of a semiprivate hospital room (not counting doctor
services) has gone up 738 percent, an increase of 11.2 percent per
year. That room now costs $5,260 per night. Inflation as measured by
the consumer price index has gone up 83 percent over the same period,
an increase of 3.1 percent per year. The consumer price index (CPI) is
a measure of inflation compiled by the U.S. Bureau of Labor Studies
(Source: Medical Mutual of Ohio, Wall Street Journal, and Department
of Labor).
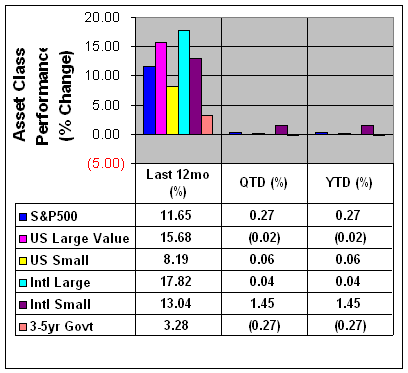
ASSET
CLASS RETURNS (see disclosures below) 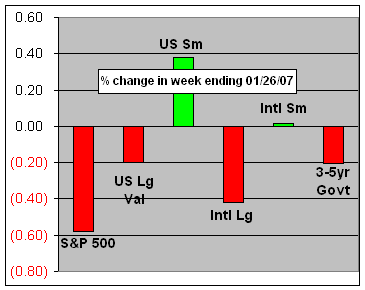
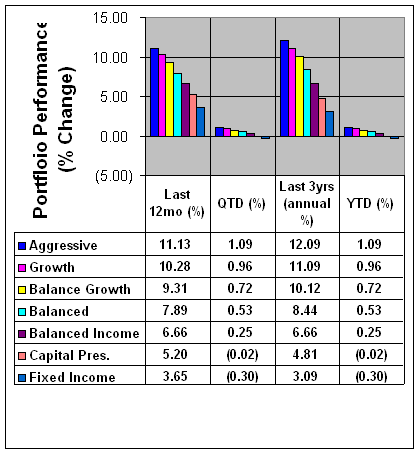
Portfolio
Performance REVIEW (see disclosures below)
|
|
|
Subscribe/Unsubscribe |
| |
"History
is a race between education and catastrophe." --H.G.
Wells
|
|
|
|
|
% change in week ending 01/27/07 |
|
S&P500 |
(0.58) |
|
US Lg Val (Russell 1000 Value) |
(0.20) |
|
US Sm (Russell 2000) |
0.38 |
|
Intl (EAFE) |
(0.42) |
|
Intl Sm (EAFE Small) |
0.02 |
|
3-5yr Govt (Bloomberg) |
(0.21) |
|
|
|
|
|
|
|
|
|
|
Important Performance Disclosure Information
|
|
Asset
Class returns are represented by market indexes that are
unmanaged baskets of securities. Investors cannot directly
invest in market indexes. Foreign securities involve additional
risks, including foreign currency changes, political risks,
foreign taxes and different methods of accounting and financial
reporting.
Portfolio Performance is the total return of
seven unique asset allocation strategies that seek to fit the
distinct needs of different investor goals, risk tolerance
levels and investment time horizon. Each portfolio contains up
to 16 individual funds totaling over 4000 securities, managed by
OppenheimerFunds.
The portfolios are designed to create efficient diversification
through the selection of mutual funds that may have a low
correlation between asset classes.
The purpose of these tables and charts is for you to follow
specific market indexes, observe asset class rotation and to
compare actual portfolio returns net of management fees.
Asset allocation strategy is available
here.
Performance
quoted is past performance and cannot guarantee comparable
future results. Performance figures reflect reinvestment of
distributions and changes in net asset value (NAV). Investment
return and principal value will vary so that you may have a gain
or loss when you sell shares. The contingent deferred sales
charge (CDSC) on Class C is 1%. No CDSC will be imposed on redemptions
of Class C shares following one year from date shares were
purchased. Performance shown does not include applicable CDSC,
which would have reduced performance.
Before
investing in any of the
OppenheimerFunds, investors should
carefully consider a fund's investment objectives, risks,
charges and expenses. The fund's prospectus contains this and
other information about the fund. Read prospectuses
carefully before investing.
|
|
| S&P 500 - Standard & Poor's 500 Index (not
including dividends) - generally considered a U.S. Large Growth
company market index. |
|
Russell
1000 Value Index (US Lg Val) - generally considered a U.S.
Large Value company market index. |
Russell 2000 Index (US Sm)- generally considered a U.S.
Small company market index. |
|
EAFE - EAFE Index (Intl) (not including dividends) Europe,
Australia, Far East and generally considered a large company
international market index. |
|
EAFE Sm - EAFE Small Index (Intl Sm) (not including dividends)
Europe, Australia, Far East and generally considered a small company
international market index. |
|
Bloomberg Silicon Valley
Index - market index of high tech companies located in the Silicon
Valley area. |
Global Hedge Fund Index - representative
of the overall composition of the hedge fund universe. It is
comprised of eight strategies:
convertible arbitrage, merger arbitrage, equity hedge, equity market
neutral, relative value arbitrage, event driven, distressed
securities, and macro. The strategies are asset weighted based on
the distribution of assets in the hedge fund industry.
See hedge
fund risks. |
|
3-5yr Treas. - Bloomberg U.S. Government Treasuries
3-5 year maturities index and generally considered a intermediate
maturity U.S. Government Note index. |
|
Asset Class - a group of
investments that share similar risk and return characteristics. |
|
All investments involve
risk, including loss of principal. Foreign securities involve additional
risks, including foreign currency changes, political changes, foreign
taxes, and different methods of accounting and financial reporting.
The
foregoing has been prepared solely for informational purposes, and is not
an offer to buy or sell or a solicitation of an offer to buy or sell any
security or instrument or to participate in any particular trading
strategy.
The information contained herein is based on
sources and data believed reliable, but is not guaranteed. Advisory
services offered through RCM Robinson Capital Management LLC, SEC
Registered Investment Advisor. Securities offered through Securities
America, Inc., Member FINRA/SIPC. Douglas C. Robinson, Registered
Representative. RCM Robinson Capital Management LLC and Securities
America, Inc. are separate and unaffiliated.
|
|
|
|
|
|
|