|
|
 |
|
|
 |
| |
Week
in review:
-
The Markets
– The
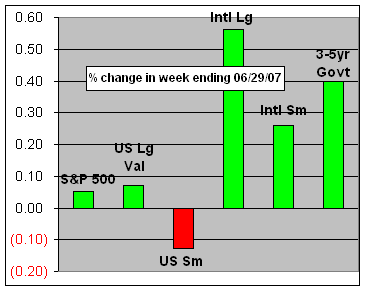
three major U.S. markets experienced a slightly positive close to the
week. The Dow ended the week up 0.36 percent to close at 13,408.62.
The S&P 500 closed at 1,503.35 up 0.05 percent, while the NASDAQ
finished the week up 0.55 percent to close at 2,603.23. International
markets continue to beat most U.S. indexes with small capitalization
stocks (EAFE Small) leading the charge, up 10.45 percent this year.
-
Fed Holds ‘Em
–
The
Federal Reserve last week left its federal funds rate, the interest
that banks charge each other, at 5.25 percent where it has stood for
the past year. The unanimous vote means the prime lending rate, a
benchmark for consumer and business loans from banks, will remain at
8.25 percent. According to the Associated Press, the Fed’s statement
depicted a better view of inflation, saying that readings had
“improved modestly in recent months.” Previous statements had
described inflation as “elevated.” Prior to the holding pattern of the
past 12 months, the Fed increased rates 17 consecutive times from a
46-year low of 1 percent to the current rate, the longest string of
hikes on record.
-
Time for Professional Help
–
According to a survey by the Investment Company Institute, respondents
with an ongoing advisory relationship most often sought professional
help initially because they experienced a trigger event such as
receiving a lump sum payment from inheritance, retirement or job
change (27 percent) or a change in household composition such as
marriage, birth or death (21 percent). Forty percent wanted to plan
for a specific goal such as retirement or education while 12 percent
said it seemed like a good idea or family or friends had recommended
it (June 2007).
-
Stocks Beat Inflation
–
The
total return of stocks has exceeded inflation on a trailing 10-year
basis at the end of each of the past 20 years (1987-2006). The average
amount by which stocks have beaten inflation over the different
decades is 261 percent. The S&P 500 was used as the stock measurement.
The consumer price index was the
measurement of inflation used and is compiled by the Bureau of Labor
Studies (Source: BTN Research).
-
Stocks Beat Bonds
–
The total return of stocks has exceeded the total
return of bonds on a trailing 10-year basis at the end of each of the
last 20 years (1987-2006). The average amount by which stocks have
beaten bonds over the different decades is 153 percent. The S&P 500
was used as the stock measurement.
The Lehman Brothers Aggregate bond index, calculated
using 6,000 publicly traded government and corporate bonds with an
average maturity of 10 years, was used as the bond measurement
(Source: BTN
Research).
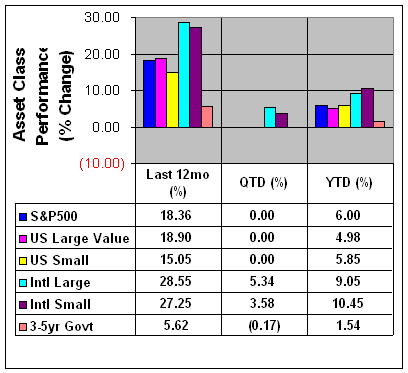
ASSET
CLASS RETURNS (see disclosures below) 

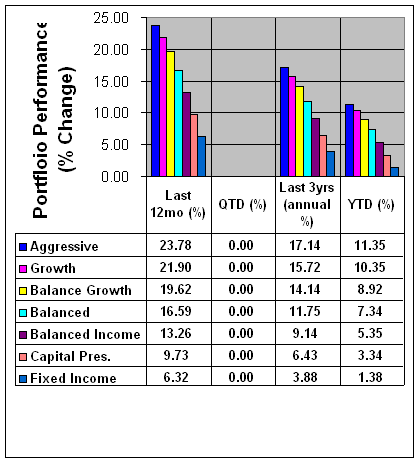
Portfolio
Performance REVIEW (see disclosures below)

|
|
|
Subscribe/Unsubscribe |
| |
"Silence
is golden when you can't think of a good answer."
-- Muhammad Ali
|
|
|
|
|
% change in week ending 06/29/07 |
|
S&P500 |
0.05 |
|
US Lg Val (Russell 1000 Value) |
0.07 |
|
US Sm (Russell 2000) |
(0.13) |
|
Intl (EAFE) |
0.56 |
|
Intl Sm (EAFE Small) |
0.26 |
|
3-5yr Govt (Bloomberg) |
0.40 |
|
Are you happy with your
investments?
The goal of RCM Robinson
Capital is to successfully advise public
institutions and private investors regarding
their institutional fixed income and investment
needs.
For more information, please
call 1-415-771-9421.
|
|
|
|
|
|
|
Important Performance Disclosure Information
|
|
Asset
Class returns are represented by market indexes that are
unmanaged baskets of securities. Investors cannot directly
invest in market indexes. Foreign securities involve additional
risks, including foreign currency changes, political risks,
foreign taxes and different methods of accounting and financial
reporting.
Portfolio Performance is the total return of
seven unique asset allocation strategies that seek to fit the
distinct needs of different investor goals, risk tolerance
levels and investment time horizon. Each portfolio contains up
to 16 individual funds totaling over 4000 securities, managed by
OppenheimerFunds.
The portfolios are designed to create efficient diversification
through the selection of mutual funds that may have a low
correlation between asset classes.
The purpose of these tables and charts is for you to follow
specific market indexes, observe asset class rotation and to
compare actual portfolio returns net of management fees.
Asset allocation strategy is available
here.
Performance
quoted is past performance and cannot guarantee comparable
future results. Performance figures reflect reinvestment of
distributions and changes in net asset value (NAV). Investment
return and principal value will vary so that you may have a gain
or loss when you sell shares. The contingent deferred sales
charge (CDSC) on Class C is 1%. No CDSC will be imposed on redemptions
of Class C shares following one year from date shares were
purchased. Performance shown does not include applicable CDSC,
which would have reduced performance.
Before
investing in any of the
OppenheimerFunds, investors should
carefully consider a fund's investment objectives, risks,
charges and expenses. The fund's prospectus contains this and
other information about the fund. Read prospectuses
carefully before investing.
|
|
| S&P 500 - Standard & Poor's 500 Index (not
including dividends) - generally considered a U.S. Large Growth
company market index. |
|
Russell
1000 Value Index (US Lg Val) - generally considered a U.S.
Large Value company market index. |
Russell 2000 Index (US Sm)- generally considered a U.S.
Small company market index. |
|
EAFE - EAFE Index (Intl) (not including dividends) Europe,
Australia, Far East and generally considered a large company
international market index. |
|
EAFE Sm - EAFE Small Index (Intl Sm) (not including dividends)
Europe, Australia, Far East and generally considered a small company
international market index. |
|
Bloomberg Silicon Valley
Index - market index of high tech companies located in the Silicon
Valley area. |
Global Hedge Fund Index - representative
of the overall composition of the hedge fund universe. It is
comprised of eight strategies:
convertible arbitrage, merger arbitrage, equity hedge, equity market
neutral, relative value arbitrage, event driven, distressed
securities, and macro. The strategies are asset weighted based on
the distribution of assets in the hedge fund industry.
See hedge
fund risks. |
|
3-5yr Treas. - Bloomberg U.S. Government Treasuries
3-5 year maturities index and generally considered a intermediate
maturity U.S. Government Note index. |
|
Asset Class - a group of
investments that share similar risk and return characteristics. |
|
All investments involve
risk, including loss of principal. Foreign securities involve additional
risks, including foreign currency changes, political changes, foreign
taxes, and different methods of accounting and financial reporting.
The
foregoing has been prepared solely for informational purposes, and is not
an offer to buy or sell or a solicitation of an offer to buy or sell any
security or instrument or to participate in any particular trading
strategy.
The information contained herein is based on
sources and data believed reliable, but is not guaranteed. Advisory
services offered through RCM Robinson Capital Management LLC, SEC
Registered Investment Advisor. Securities offered through Securities
America, Inc., Member FINRA/SIPC. Douglas C. Robinson, Registered
Representative. RCM Robinson Capital Management LLC and Securities
America, Inc. are separate and unaffiliated.
|
|
|
|
|
|
|